Positive self-starter, working in a fast-paced environment; well-balanced and efficient work ethic. Skilled in creating intuitive user experiences across platforms. Driven and innovative, eager to work with teams and/or individually to create excellent work.
CASE STUDY
Adaptive Dashboards & Analytics

ADAPTIVE ANALYTICS
REDESIGN
LEAD PRODUCT DESIGNER
Design management, design strategy, research facilitator, testing, UX/UI design
MY ROLE
I worked closely with a cross-functional team of PS, product manager, and developers to redesign a seamless integrated experience through visual redesign and improved usability
Facilitated white board session to define product goals and strategy
Collaborated and built relationships with dev, product, and other teams
Advocated for design, research and users
Created a holistic design vision and scalable design system
THE CHALLENGE
MAKING THE UNUSEABLE USABLE
Adaptive Insights acquired an analytics application, myDials, which was renamed as Discovery (or Dashboards) in 2012 to expand the business model, but the team struggled to integrate it. The app was over engineered leading to very low adoption and supports
The app was built with EXTJS and was primarily designed by engineers. Users felt anxious due to the cluttered nature of the UI and often got confused because there was no distinct process or flow.


THE GOALS
redesign & integrate
CRITICAL REQUIREMENTS
The requirements were grouped in two separate tracks:
1. Redesign the app providing simple, coherent and visually refined UI
2. Integrate the analytics into the existing Adaptive Suite
Redesign
Leverage Angular frame work. Update look & feel. Redesign workflows and screen layout. Adopt latest design language
Integrate
Support financial planning use cases. Simplify functionality. Integrate analytics with other Adaptive apps
1/2 COLLECTING THE DATA
RESEARCH
BASELINE HEURISTIC EVALUATION
The first step in fixing the application required me to understand the problem. I conducted user research, got user feedback from multiple sources, and then presented my executive management findings. As a result, I got buy-in and commitment to begin the redesign process

WHO WOULD NEED DASHBOARDS - VISUAL ANALYTICS?
This is a collaborative effort that I conducted together with another UX resource. We talked to 13 internal experts and 21 Adaptive customers to understand their user goals, challenges, and task flows


Data showed that our customers had particular needs. Personas helped define our customers, it provided insight into who would need dashboards, how often, and when during a typical financial budget cycle.

Integrate
ADHOC ANALYSIS
DIAL CREATOR - So that was the challenge. How could we bring analytics closer to financial planning (Sheets and Report apps)? How would we enable ad-hoc analysis in time, when user needed it to understand a business problem, while working on a specific sheet or report?
We were thinking of having the dial creator available in all apps, worked in context of the data that user viewed at the moment. The cool idea was to enable business insights instantly and contextually.

VoS (Visual on Sheets) was the first project launched for this purpose. Sheets was the main product for constructing Planning data model. Users often had needed to change assumptions, explore data, etc. We were enabling ad-hoc analytics, where users selected any data on the sheet then call out the chart editor. They can even add more accounts to the chart, change series, switch chart types, etc. to analyze in place
After the creation, the user may save the dial as a report or pulled it into a dashboard for tracking.


Integrate
USER RESEARCH
DASHBOARDS AS AN A COLLABORATION TOOL - I conducted empathy research in 2017 with 9 users to learn about their existing mental model, ranging from FP&A, Budget Owner, and CFO. The goals were to understand what were pain points when using Dashboards.
We found that financial planning required collaboration between executives and FP&A, yet current ad-hoc analysis, running silos. The apps in Adaptive were done with a modular design. Sheets, Reports, and Dashboards were all separated. Users needed to adjust assumptions, analyze, track KPIs separately. That made conversation between business teams became cumbersome, going back and forth.
Would it be better if we may integrate Sheets, Reports into Dashboards instead? All these components would interact relationally to each other. Could Dashboards become a central playground where executives, FP&A, budget owners may look at global business contexts under one place? They may debate, make changes, and agreed much faster.
( Will go through the research in an interview)

An informal user feedback session at Adaptive Live conference - 2017
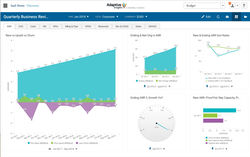
2/2 DESIGN
DESIGN
Redesign
DASHBOARDS
 |  |  |
|---|---|---|
 |  |
Redesign
3/3 PRODUCTION
DESIGN SYSTEM
Deliverables was a modular design system based on atomic design principle. It contains different pieces that can be assembled into more complex components and pages. Atoms are the building blocks of UI. They're the smallest elements which can't be broken down further without losing their meanings.
We delivered examples, documentation, and style guidelines.
Redesign
COMPONENT SPECS EXAMPLE
(Request for a link to Figma file. Will demo for an interview)

Redesign
SEMANTIC SPECIFICATION
(Request for a link to Figma file. Will demo for an interview)

Redesign
INTERACTION SPECS EXAMPLE
(Request for the file to review. Will demo for an interview)

Mentions
"My preference is to bring them (Sheets & Reports) to, uh... more like Discovery just because of the visualization"
- Sharon Kelly, Manager Financial Planning & Analysis at OANDA
" Scenario analysis in Planning (Sheets/Reports) is cumbersome! You know, some of what like... in Discovery, I think... if we are able to sit with her (CEO) and say ok what do you want to know? And I will be able to show that to her immediately, without creating any version. I think that will be useful"
- Kate Reeder, Manager Financial Planning & Analysis at Crimson Hexagon
"There is definitely a need for analytics... but we will have to make sure that we can bring the data from Salesforce and and other data sources"
-Beth Walkley, Chief Budget Officer at Ramapo College of New Jersey
THOUGHTS & LEARNING
You are not your users
None of the Analytics team at Adaptive Insights (Not Planning team) had a financial background. Without first-hand experience, how could we understand their roles & mental models, and build a helpful product for financial users? It was crucial for us to invest time and effort to step into our users' shoes through self studies and user researches.
Building relationship with teams
When it came to building relationships working with the Dev team in another country, it taught me to listen and understand their point of view, technical limitation, and any infrastructure barriers. I then took what I learned from users to inform our design proposal with fact-based findings to discuss and perhaps challenge to push for more compelling outcomes. Presenting a holistic point-of-view demanded great communication and team trust in a startup environment, where deadlines were often aggressive.